

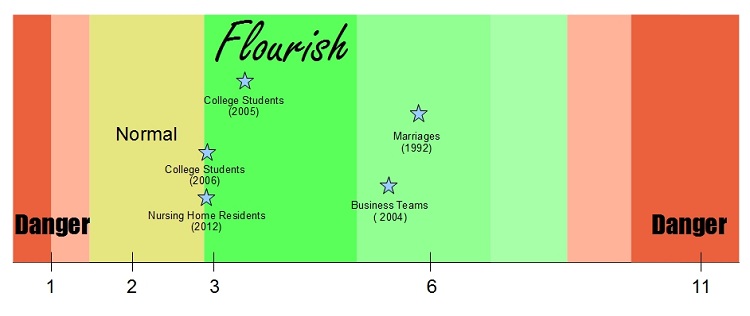
The Losada ratio is the sum of the positivity in a system divided by the sum of its negativity. A ratio of 3.0 to 6.0 has been found to be highly correlated with high performance.
The Losada ratio is also known as the positivity ratio, Gottman ratio, and Losada line.
The first suspicion of a positivity ratio came from the field of marital stability and relationship analysis, from the research of John Gottman. Over the course of dozens of studies and thousands of observations, he gained the ability to predict whether or not a couple would divorce with over 90% accuracy. A key factor of that prediction was the ratio of positive expressions to negative expressions.
The second suspicion of a positivity ratio came from the field of organizational psychology, from the research of Marcial Losada. Adopting Gottman's coding methodology for business teams, Losada observed teams of eight while they developed strategic plans. Once again, the ratio of positive expressions to negative expressions was highly predictive of team success, as judged by both hard numbers like profitability, and soft numbers like evaluations by colleagues and superiors.
The study which finally brought the positivity ratio to its current level of popularity came from the field of positive psychology, from the research of Barbara Fredrickson. She found that college students with a positivity ratio above 3 were significantly more likely to have high mental and social health.
These findings have been subsequently confirmed in additional settings (e.g. a nursing home), having been cited over 700 times.
What's my Losada ratio, and what does it mean?
You can take a quick test here to find out your positivity ratio.
In general, the higher your ratio the better. There are limits – above 6 and especially above 11, but most people are unlikely to ever approach such high levels.
Positive emotions are beneficial in many areas of life, increasing general health, lifespan, social functioning, mental health, income, productivity, and more.
Can I increase my positivity ratio?
Absolutely. There are dozens of positive psychology exercises you can use to increase your positivity ratio. I've personally increased my ratio from 1.7, six months ago, to 2.6 now. In order, I've found the following four exercises to be the most effective in increasing Losada ratio: laughing, gratitude, physical exercise, and self-compassion.
Why 2.9 and above on Losada Line?
The commonly mentioned dividing line of 2.9 has now been shown to be bogus. More accurate is a positivity range, of around 3 to 6. Why is so much more positivity than negativity required to reach a state of flourishing?
Humans experience negativity much stronger than positivity. This tendency can be seen in many fields, from behavioral economics to psychology. Compare:
Upon seeing you, a friend compliments your appearance.
-VS-
Upon seeing you, a friend insults your appearance.
The compliment is likely to make you feel better for a few moments – maybe even a few hours. The insult is likely to keep playing on repeat for hours, maybe even days.
For a system to be in a positive state, a significant amount of positivity is required to balance against the over-weighted power of negativity.
But why does positivity lead to increased performance? It's an evolutionary adaption – happiness is a signal that it's okay to make long-term investments.
An Example:
From Barbara Fredrickson's paper, Beyond the Moment:
When we are in a state of relative safety and satiety—when there are few threats demanding intense, narrowed attention—positive emotions allow us to pursue our long-term interests. In our ancestors, transitory states of positive emotions led to behavior that may seem pointless or extravagant from the perspective of immediate survival, but that perhaps conferred serious advantages in the long term.
A positivity ratio above 3.0 signaled safety and satiety – that Joe was surrounded by friends, healthy, had a stockpile of food, and that now was the best time to make long-term investments.
That is the function of positive emotion – to tell the body, now is the time – you are safe, so you can stop worrying about the day-to-day worries of the present, and go make true your dreams of the future.
To learn more, read this article.
Why do we even need negativity?
Said differently, why is too much positivity a bad thing? It can be dysfunctional. Let's take a simple example:
You were born highly optimistic. Wanting to produce even more positive emotion, you spend years increasing your natural levels of optimism through cognitive behavioral therapy.
One day, you decide to move to Italy and start a vineyard. Your friends warn you to be cautious, “you don't know anything about the business, and you can't even speak Italian!”
Feeling optimistic, you believe you can learn things along the way. Unfortunately, reality bites back hard – your first batch of grapes sours and the second produce disgusting wine. The third batch produces a wine that is OK, selling a few bottles, but not enough to cover your costs. Your friends caution you to chalk up the failure to life experience and move on.
Feeling optimistic, you believe you can turn things around. With your credit already ruined, you turn to your friends and family for money. You continue to fail. You go broke, in the process ruining not just your life, but that of those around you.
Negative emotion can be useful.
Dysfunctional Mathematics Controversy
According to the original proponents of the Losada ratio, 2.9 marks the dividing line between normal and flourish. That number came from the use of incorrectly applied complex mathematics. Barbara Fredrickson and Losada modeled human performance against positive and negative emotion using a three-dimensional non-linear, dynamic system. If you want a sense of what that means, read the section below in red.
The math behind 2.9 has now been proven bogus. The underlying theory that positivity induces flourishing is still valid, but the idea that some universal dividing line exists at 2.9 has been disproven. To summarize the problems:
- The value 2.9 was asserted as being the dividing line across all situations for all people. We know this is false because a quick look at the actual studies done shows a range of dividing lines. This makes sense – things will be different for people of different age, gender, educational level, personality, group membership, and so on.
- There were a number of mathematical errors. No need to take my word for it – from one of the two original authors of the theory, Barbara Fredrickson, “I’ve come to see sufficient reason to question the particular mathematical framework Losada and I adopted.”
Chaos Theory & Positive Psychology?
Both Losada and Barbara Fredrickson modeled human performance against positive and negative emotion using a three-dimensional non-linear, dynamic system. That modeling has now been shown to be bogus, but for historical purposes, I preserved my original attempt to explain the math.
What's a non-linear system?
Let's start with a hypothetical model of happiness:
Happiness (value of 0 to 10) = Money (value of 0 to 5) + Optimism (value of 0 to 3) + Gratitude (value of 0 to 2)
This is an example of a linear model. In English – the variables don't interact with one another. An example:
Joe is well off doctor (money = 5), slightly pessimistic (optimism = 1), and not very grateful (gratitude=.25).
Using the equation above, his happiness = money (5) + optimism (1) + gratitude (.25) = 6.25
So he's doing okay. If, through HappierHuman training, Joe increased his levels of gratitude by 100%, to .5, his happiness would increase by 4%, to 6.5.
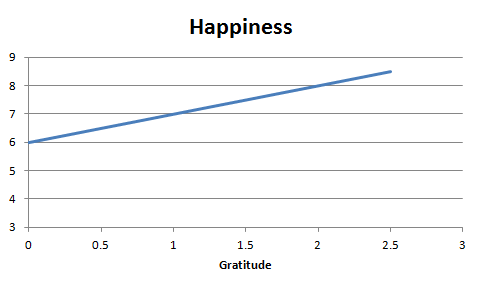
But that doesn't seem right… The model is too simplistic. A doubling of gratitude should increase happiness by much more than 4%.
A more accurate model would look like this:
Happiness = MoneyGratitude + Optimism
This is an example of a non-linear model – some of the variables interact with one another. Rather than the money and gratitude scores being added together, the money score is being exponentially increased by the gratitude score. This model is also too simplistic, but is more realistic – after all, what point is there to having tons of money if you can't appreciate and be grateful for it?
Now, when Joe's levels of gratitude doubles, his happiness increases by 30%.
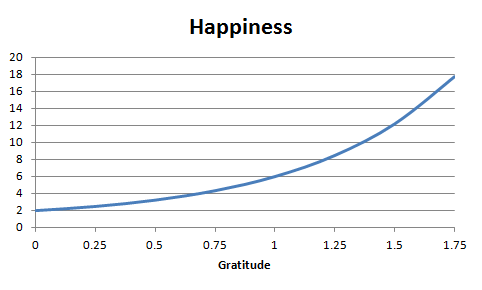
Human emotions are incredibly powerful, and they build on themselves. Let's say you had become 10% happier five years ago, it's highly likely your life now would be entirely different. Much like the butterfly effect, small changes in emotion can have profound effects down the road – hence the need for a non-linear system (more: chaos theory).
What's a three-dimensional system?
The two graphs above show how changing levels of gratitude changes levels of happiness. But what if we wanted to see what happens when changing money and gratitude, at the same time?
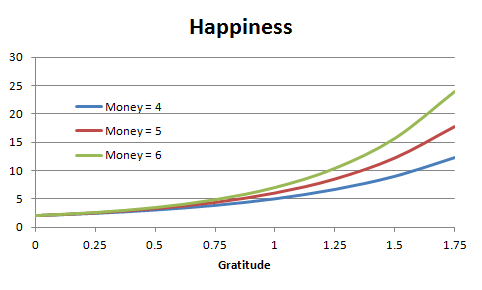
That's what it would look like. At lower levels of gratitude, each of the three lines is about the same. But as gratitude continues to increase, the happiness value of the hypothetical man with lots of money (money = 6), starts shooting above the others.
The complex dynamics of business teams.
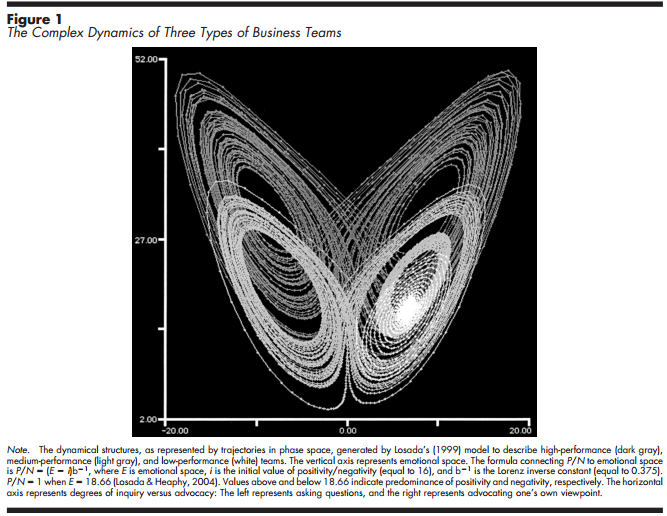
Putting it all together, the above graph is a model connecting the positivity ratio of business teams with their level of performance.
The x-axis contains a two-dimensional representation of performance. At -20, the business team has lots of people asking questions. At +20, the business team has lots of people advocating their own viewpoints. Clearly, we want a business team that does both – one that learns and is open to new ideas, but that also acts on its beliefs.
The y-axis contains the emotional space of the business team. Recall that we want lots of positive… but also some negative? For that, a team needs a large emotional space, one that accommodates all sorts of behaviors (questing, optimistic, pessimistic, etc…). The Losada ratio directly controls the size of the emotional space.
This graph is three-dimensional because, like the happiness graph with 3 curves, this graph has three different curves, each with a different positivity ratio.
The largest set of figure-eight lines, in gray, represents a high-performing team. We know this team is high-performing because they have dots across the entire graph – points where they’re open to new ideas, points where they’re advocating their own ideas, and points where they’re neutral.
The smallest set of figure-eight lines, in blinding white, represents a low-performing team. This curve has only a few points, all of which are centered around self-advocacy.
This is the basis of the theory behind the positivity ratio. Too much negativity restricts the range of possible behaviors to a few options. On the other hand, a positivity ratio above 2.9 expands the range of behavior. That flexibility, in turn, contributes to high-performance.
This is also the reason why this model predicts that too much positivity is bad – as you can see, the curve with a high positivity ratio is larger than the curve with a small positivity ratio. Once the ratio passes 11, the curve gets too big. So big, in fact, that the entire model breaks down.
Show me the science!
The Role of Positivity and Connectivity in the Performance of Business Teams: A Nonlinear Dynamics Model
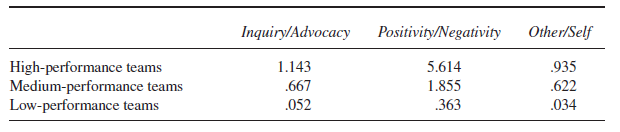
This study attempted to correlate the performance of business teams with their relative displays of positivity to negativity, inquiry to advocacy, and other orientation to self-orientation.
Protocol60 business teams of eight individuals each were observed in a computerized lab while they developed strategic plans.
VariablesThe “verbal communication among team members” was coded along three bipolar dimensions and then tested against performance levels.
Positivity/Negativity (P/N): “A speech act was coded as “positive” if the person speaking showed support, encouragement or appreciation (e.g., “that’s a good idea”), and it was coded as “negative” if the person speaking showed disapproval (e.g., “that’s about the dumbest thing I ever heard”), sarcasm, or cynicism.”
Inquiry/Advocacy: “A speech act was coded as “inquiry” if it involved a question aimed at exploring and examining a position and as “advocacy” if it involved arguing in favor of the speaker’s viewpoint.”
Other/Self: “A speech act was coded as “self” if it referred to the person speaking or to the group present at the lab or the company the person speaking belonged, and it was coded as “other” if the reference was to a person or group outside the company to which the person speaking belonged.”
Team Performance: “The sample of 60 business teams was subdivided into three performance levels based on extensive business performance data.” Data included measures of profitability, customer satisfaction, assessments by superiors, peers, and subordinates. “A team was assigned to the high-performance category if it achieved high ratings in all three measures. A team was assigned to the low-performance category if it had low ratings in all three measures. Medium performance teams did not achieve ratings that were either consistently high or consistently low.”
ResultsThe combination of the inquiry/advocacy and other/ self-ratios was able to predict high-performance. The positivity/negativity ratio, in turn, was able to predict inquiry/advocacy, other/self, and high-performance. The non-linear Lorenz model build by Losada uses the positivity/negativity ratio to predict the inquiry/advocacy and other/ self-ratios, which in turn predict performance.
“The P/N ratio for high-performance teams is very similar to the one that Gottman (1994) found for couples that were able to achieve a harmonious and sustainable relationship over time. Gottman also found that couples whose marriages ended in divorce had a preponderance of negativity over positivity in their overall interaction over time, just like the low-performance team in our study: ‘Dissolution is related to positive-to-negative ratios of less than one (there is more negative than positive), whereas stability is associated with ratios that are around 5.0' (Gottman, 1994, p. 331).”
Concerns
The optimal ratio calculated by this study is 5.6, which is a full 2.5 points higher than the ratio recommended by most of the other losada ratio studies. Is this because the focus was on business teams rather than human individuals? Because of the coding methodology?
Full study here.
Losada, M., & Heaphy, E. (2004). The Role of Positivity and Connectivity in the Performance of Business Teams. American Behavioral Scientist, 47(6), 740-765. doi:10.1177/0002764203260208
Positive Affect and the Complex Dynamics of Human Flourishing
This study tested the Losada hypothesis on individual adults (a prior, the hypothesis had been only tested on marriages and business teams), as well as summarizing the existing literature. This study has been cited over 700 times, making it one of the most popular positive psychology studies to date.
Protocol188 college students completed a number of surveys over the course of a month.
VariablesEach evening for 28 days, participants completed a test similar to this one, which calculates a positivity ratio by dividing the number of strongly felt positive emotions experienced over the past 24 hours by the number of strongly felt negative emotions. A monthly positivity ratio was calculated by taking an average of the daily ratios.
In turn, this ratio was compared against the results of a 33-item measure of psychology and social function (Keyes, 2002). Those with high scores on this measure were classified as flourishing; those with medium and low scores as non-flourishing.
ResultsThe mean positivity ratio for flourishing individuals was 3.3. The mean positivity ratio for non-flourishing individuals was 2.2.
ConcernsThe sample size isn't small, but neither is it so large that this study should be cited over 700 times before replication.
The sample is off only college students. It is possible that different types of people in different periods of their lives may have different positivity ratios.
The definition of flourishing used in this study is limited to mental and social health. Is there also a correlation between the positivity ratio and GPAs? If not, why isn't increased mental and social health translating into improved academic performance?
Full study here.
Fredrickson, B. L., & Losada, M. F. (2005). Positive Affect and the Complex Dynamics of Human Flourishing. American Psychologist, 60(7), 678-686. doi:10.1037/0003-066X.60.7.678
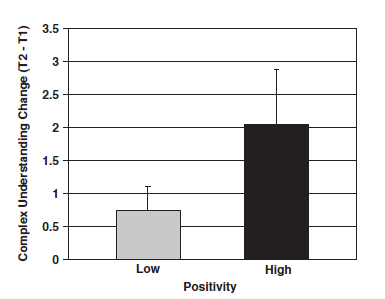
Nice To Know You: Positive Emotions, Self–Other Overlap, and Complex Understanding in the Formation of a New Relationship
This study tested the hypothesis that a higher positivity ratio among new college students would predict them having a better understanding of and relationship with them.
Protocol247 first-year college students completed a number of surveys during a number of different times: 3 weeks before their semester started, 1 week after classes began, 5 weeks after classes began, and daily for four weeks, between week 1 and week 5.
VariablesEach evening for 4 weeks, participants completed a test similar to this one, which calculates a positivity ratio by dividing the number of strongly felt positive emotions experienced over the past 24 hours by the number of strongly felt negative emotions. A monthly positivity ratio was calculated by taking an average of the daily ratios.
In turn, this ratio was compared against self-other overlap (perceived relationship closeness), and complex understanding of others (rather than seeing their roommate as a singular entity, e.g. good or bad, instead seeming them as sometimes good and sometimes bad). Extroversion was also measured as a control.
ResultsEven after controlling for extroversion, the positivity ratio was significantly predictive of self-other overlap, both at week 1 and week 5.
The positivity ratio affected self-other overlap partially through its impact on the increasing participants complex understanding of their roommates. Those with a high ratio experienced about three times as much of an increase in their complex understanding from week 1 to week 5.
The average positivity ratio of those with a high self-other overlap and complex understanding was 2.9; the average ratio of those with low scores was 2.13.
ConcernsThe cut-off point between high and low can be arbitrarily defined so that the average ratio of the high group is 2.9. Was the cut-off point actually arbitrarily defined in such a way?
Full study here.
Waugh, C.E. & Fredrickson, B.L. (2006). Nice to know you: Positive emotions, self-other overlap, and complex understanding in the formation of a new relationship. The Journal of Positive Psychology, 1(2), 93–106.
Marital Processes Predictive of Later Dissolution: Behavior, Physiology, and Health
A longitudinal study which attempted to find variables which could be used to classify a couple as being at risk for divorce.
Protocol
79 couples were observed in a lab, where their positive and negative interactions were observed and coded in detail by researchers. Couples were instructed to discuss problem areas in their marriage with one another. The couples were surveyed twice – once at the beginning of the study, and a second time four years later.
Variables
Interactions coded as positive included: neutral or positive problem description, task-oriented relationship information, assent, humor-laugh, and miscellaneous other positive.
Interactions coded as negative included: complain, criticize, negative relationship issue problem talk, yes-but, defensive, put down, escalate negative affect, and miscellaneous other negatives.
Based on these interactions, couples were separated into two groups: regulated and unregulated. Although the classification algorithm used many different sources of data to build the classification (individual interaction codes, like anger and withdrawal, the sum of the positive interaction codes, the sum of the negative interaction codes, etc…) the most predictive component of the classification was the ratio of the sum of the positive interaction codes to the sum of the negative interaction codes.
The regulated couples had a positivity ratio of about 5.8; the unregulated couples a ratio of about .86.
Results
During the 4 year period, nonregulated couples were three times more likely to consider divorce, twice as likely to get separated, and 2.5 times as likely to get divorced as regulated couples.
Concerns
How easily can the positivity ratio of a couple be changed?
If it could be changed, would that actually impact that probability of getting divorced (correlation vs. causation)?
Why do Gottman's later papers on predicting divorce tend towards using other models (that is, non-positivity ratio models)?
Full study here.
Gottman, J. M., & Levenson, R. W. (1992). Marital Processes Predictive of Later Dissolution: Behavior, Physiology, and Health. Journal Of Personality & Social Psychology, 63(2), 221-233.
The Complex Dynamics of Wishful Thinking: The Critical Positivity Ratio
This paper raises a number of fair critiques against the math behind the universal 2.9 dividing line. The abstract:
“We examine critically the claims made by Fredrickson and Losada (2005) concerning the construct is known as the “positivity ratio.” We find no theoretical or empirical justification for the use of differential equations drawn from fluid dynamics, a subfield of physics, to describe changes in human emotions over time; furthermore, we demonstrate that the purported application of these equations contains numerous fundamental conceptual and mathematical errors. The lack of relevance of these equations and their incorrect application lead us to conclude that Fredrickson and Losada’s claim to have demonstrated the existence of a critical minimum positivity ratio of 2.9013 is entirely unfounded. More generally, we urge future researchers to exercise caution in the use of advanced mathematical tools such as nonlinear dynamics and in particular to verify that the elementary conditions for their valid application have been met.”
You can read the full paper here.
Brown, N. J., Sokal, A. D., & Friedman, H. L. (2013). The Complex Dynamics of Wishful Thinking: The Critical Positivity Ratio.
Updated Thinking on Positivity Ratios
This is Barbara Fredrickson's response to the critique above. The paper can be summarized in one sentence,
“I’ve come to see sufficient reason to question the particular mathematical framework Losada and I adopted.”
She argues, and I agree, that although the math is incorrect, the idea that positivity in moderation is beneficial is still true, and can be well described by the broad-and-build theory of positive emotion.
You can read the full response here.
Fredrickson, B. L. (2013). Updated Thinking on Positivity Ratios.
Toward a Humanistic Positive Psychology
This paper raises a number of fair critiques against the mindset of positivity and the wide, out-of-context use of the positivity ratio. However, most of its arguments are non-sequitur or straw men. In addition, the paper argues for a “humanistically informed positive psychology.”
I personally disagree, but the paper is an interesting read.
Ben-Sharar says it well,
The fundamental difference between humanistic psychology and positive psychology is in their relationship to research, epistemology, and methodology. Many who joined the ‘Third Wave’ were not rigorous. Humanistic psychology gave birth to the self-help movement, and lots of self-help books have come out with concepts grounded in emotion and intuition. Positive psychology combines those things with reason and research.
You can read it here.
Schneider, K. (2011). Toward a Humanistic Positive Psychology. Existential Analysis: Journal Of The Society For Existential Analysis, 22(1), 32-38.
Altering Positive/Negative Interaction Ratios of Mothers and Young Children.
Because this study had a small sample size (eight mother-child pairs, for 16 participants total), I quote the paper's abstract below rather than providing my own summary.
“Based on classic marital research of John Gottman, a popular notion exists that interpersonal relationships thrive when the number of positive interactions outweighs negative interactions by a ratio of five to one. Though many have given similar advice for parents and caregivers, Gottman's findings and methodology may not generalize to relationships of parents and young children. Were similar ratio findings to be validated for parent-child relationships, explicit ratio advice may be incorporated as a component of clinical practice (e.g., behavioral parent training). To begin investigating potential clinical implications, a project was conducted that examined mothers' ability to achieve prescribed ratios following brief instruction. Baseline ratio levels for a small sample of nonclinical mother-child dyads were approximately one positive for every one negative. When instructed to attain a 5 to 1 ratio, all participants improved their ratios; half the sample achieved the target ratio. Mothers in the study altered their ratios primarily by boosting the number of positives they used with their children.”
Full study here.
Armstrong, A. B., & Field, C. E. (2012). Altering Positive/Negative Interaction Ratios of Mothers and Young Children. Child & Family Behavior Therapy, 34(3), 231-242. doi:10.1080/07317107.2012.707094
Positivity and Well-being Among Community-Residing Elders and Nursing Home Residents: What Is the Optimal Affect Balance?
Because I do not have access to the full study, I quote the paper's abstract below rather than providing my own summary. If you can help me procure access to this paper, I will send you a virtual hug (or I can send you a cookie, if you'd prefer).
“To explore whether a ratio of positive to negative affect, from the work of Fredricksen and Losada, could predict high levels of well-being in elderly samples and especially in nursing home residents despite multiple chronic health conditions, consonant with Ryff and Singer's notion of “flourishing under fire.” Method: We used two samples: a probability sample of community-residing elders and a sample from nursing homes. We calculated ratios of positive to negative affect in each sample and measured well-being with social interaction, mental health, life satisfaction, and general well-being. Results: The positivity ratio of 2.9 differentiated high levels of well-being in both the samples, as in previous research on younger samples. Discussion: Although we expected the positivity ratio to perform less well among nursing home residents, we found that it differentiated residents with high well-being just as well as in the community sample. The ability to regulate positive effect to maintain a relative ratio of positive over negative effect appears to be an important aspect of successful adjustment in late life. Further research is needed on objective indicators of quality of life and on whether intra-individual shifts in affect balance are coupled with shifts in indicators of positive mental health.”
More information here.Meeks, S., Van Haitsma, K., Kostiwa, I., & Murrell, S. A. (2012). Positivity and Well-being Among Community-Residing Elders and Nursing Home Residents: What Is the Optimal Affect Balance?. Journals Of Gerontology Series B: Psychological Sciences & Social Sciences, 67(4), 460-467.
Finally, one proven way to improve your happiness and life satisfaction is to focus on goals that truly matter. To get started, check out this FREE printable worksheet and a step-by-step process that will help you set effective SMART goals.
It’s something unique.Psychological Mathematics,like a hypothesis.Very interesting,I think practicing this one can achieve success in life.Certainly a valuable exercise to undertake with all
seriousness.I think it’s a kind of meta physics,only to covert&apply in ones life.
The mathematics behind the main paper on the positivity ratio — Fredrickson and Losada (2005) — has been severely critiqued…
http://blogs.discovermagazine.com/neuroskeptic/2013/07/16/death-of-a-theory#.UfapdpyAHQo
http://psycnet.apa.org/?&fa=main.doiLanding&doi=10.1037/a0032850
… and all but retracted by Fredrickson herself…
http://psycnet.apa.org/?&fa=main.doiLanding&doi=10.1037/a0033584
All that remains, it seems, is for Fredrickson to formally withdraw the paper…
http://blogs.discovermagazine.com/neuroskeptic/2013/07/28/notes-on-positivity-ratio/#.Ufap6JyAHQo
David – thank you for sharing!
After I digest these new thoughts, I’ll change the page to reflect the new information. I’m not sure I agree that the paper should be withdrawn, but the idea that the math is bogus isn’t surprising.
Hi, Amit:
Well, withdrawing is up to her — the vast majority of her work is still presumably still of value. In fact, her rejoinder is mainly a defense of the rest of her substantial and highly-decorated oevre. Too bad someone of such accomplishments fell for what appears to be pseudo-mathematical snake oil. Apparently, the “math” is about 2/3’ds of the 2005 paper, so she probably should withdraw it. Maybe she can write a personal story of how all this came to be — would be extremely instructive, I bet.
In my comment, please change “formerly” to “formally”. Sometimes the connection between my mind and my fingers has a hiccup.
Thanks. –David
Please provide the email of the person who does this site. I’d like to share notes, possibly clients.
I am a former M.D., trained ADHD and Executive Functions coached, and a speaker for CHADD. I’ve written for the ADHD Coaches Organization Circle online, and I’ve taught at both university and medical school.
My “flavor” adds to your stated goals: explicit Positive Psychology (to which you refer), a developmental perspective – pediatric and adult – acquired by my professional training, VIA strengths, and the use of the Barkley Deficits in Executive Function Scale.
The descriptions of nonlinear systems here is not relevant to the modeling in the Frederickson and Losada (2005) paper. See the recommendation inhttp://journal.frontiersin.org/Journal/10.3389/fpsyg.2012.00382/full
to maintain the distinction between dynamical and non dynamical models. The nonlinear models presented here are not dynamical models.
Alert on submission for access to booklet.
Mailing List Not Active
This mailing list is not currently active.
Please notify the website owner.
Good article . Apropos , others are interested in a CA STD 678 , my friend found a fillable form here
http://goo.gl/AOryhp.